


Engagement Rate Benchmarks 2026: Platform and Industry Guide
- Elana Rheinhart
- 5 days ago
- 15 min read

Across all major platforms, 2026 engagement rate benchmarks show a clear hierarchy: TikTok leads with a median engagement rate notably higher than Instagram, which is in turn higher than LinkedIn, X, Instagram Reels, and Facebook. As a working rule of thumb, a rate within a moderate range is generally considered good in 2026, though that range shifts meaningfully by platform, industry, and follower count.
The table below gives you a quick reference before you go deeper into platform or industry specifics.
Platform | Typical 2026 Median ER | Metric Basis |
TikTok | higher engagement | Views / followers |
moderately high engagement | Followers | |
Instagram Reels | moderate engagement | Views / reach |
moderate engagement | Impressions / followers | |
X (Twitter) | lower engagement | Impressions |
low engagement | Reach / followers |
For platform-level breakouts and format notes, go to the next section. For industry comparisons, jump to the industry benchmarks section. For follower-tier ranges, the tier section gives you the specific numbers.
Key Takeaways
Point | Details |
TikTok leads all platforms | TikTok’s 2026 median ER is 4.25%, roughly 2.3× higher than Instagram’s across comparable tiers. |
Follower tier sets your baseline | Nano accounts (1K–10K) should target 5–7% on Instagram; macro accounts should expect 1.5–2.5%. |
Industry adjusts the target | Healthcare and financial services run 30–50% below retail and entertainment benchmarks on the same platform. |
Median beats mean for target-setting | Use median-based benchmarks from bot-cleaned, large-sample reports to avoid skew from viral outliers. |
SOL Social Media applies tier-matched benchmarks | SOL Social Media builds engagement strategies using industry- and tier-adjusted targets, not platform averages. |
What are the 2026 engagement rate benchmarks by platform?
Every platform counts “engagement” differently, which is the first thing to get right before you compare numbers across channels. Likes on Instagram, reactions on Facebook, and video completions on TikTok are not equivalent signals, even when they all feed into a percentage.
SociaVault’s 2026 analysis of 350,000+ accounts puts TikTok at the top with a 4.25% median, roughly 2.3 times higher than Instagram’s median across comparable follower tiers. That gap is persistent and structural, driven by TikTok’s algorithm distributing content to non-followers far more aggressively than Instagram’s feed does.
Format-specific notes worth knowing
Instagram: Reels consistently outperform static feed posts in reach, but their ER calculated by views often runs lower than feed ER calculated by followers. You’re comparing different denominators, so be explicit about which formula you’re using before drawing conclusions. Stories are typically excluded from standard ER calculations because impressions decay quickly and the data is harder to normalize.
TikTok: Video completion rate is a stronger signal of content quality than raw ER on this platform.
LinkedIn: Clicks count as engagements in LinkedIn’s native analytics, which inflates ER compared to platforms that only count social actions. When benchmarking LinkedIn against Instagram, strip clicks out for a cleaner comparison.
Don’t write off Facebook based on the percentage alone.
Pro Tip: Never compare your account’s ER to a platform median without first confirming you’re using the same formula. A LinkedIn ER calculated by followers will look very different from one calculated by impressions, and both are technically correct.
How do 2026 engagement rates differ by industry?
Overall platform medians are a starting point, not a verdict. A healthcare practice and a consumer retail brand on the same platform, with the same follower count, should expect meaningfully different engagement rates because their content types, compliance constraints, and audience intent differ.
ICUC’s 2026 benchmark data recommends pairing ER with complementary metrics like reach, CTR, and follower growth rate, particularly for regulated or service-driven industries where a single ER figure can be misleading. A healthcare account that posts carefully worded, compliance-reviewed content will naturally see fewer comments than a food brand running a giveaway, even if the healthcare content is genuinely resonating.
Why some industries run higher
Entertainment and nonprofit accounts benefit from emotionally resonant content that naturally invites sharing and commenting. Education content on LinkedIn performs well because the platform’s algorithm rewards professional development posts with extended distribution. Financial services and healthcare, by contrast, face compliance reviews that limit the spontaneity and variety that tend to drive engagement.
Consider two accounts: a 10,000-follower retail brand and a 10,000-follower financial services firm, both on Instagram. Neither account is underperforming relative to its industry. Benchmarking the financial services firm against the retail average would produce a false conclusion.
Key insight from ICUC: For regulated industries, engagement rate alone is an incomplete performance signal. Pair it with reach growth and CTR to get a fuller picture of whether content is actually moving your audience toward a conversion.
How does follower count affect your expected engagement rate?
Smaller accounts almost always outperform larger ones on a percentage basis. This is one of the most consistent patterns in SociaVault’s 2026 tier data, and it holds across every major platform. The mechanism is straightforward: nano and micro accounts tend to have tighter, more invested communities, while mega accounts accumulate passive followers who never interact.
Here are the standard tier definitions used in 2026 benchmark reporting:
Nano: 1,000–10,000 followers
Micro: 10,000–50,000 followers
Mid-tier: 50,000–200,000 followers
Macro: 200,000–1,000,000 followers
Mega: 1,000,000+ followers
Expected ER ranges by tier (2026)
TikTok:
Nano: ~7.84% median
Micro: ~5.5%
Mid-tier: ~3.8%
Macro: ~2.5%
Mega: ~1.84%
Instagram:
Nano: ~5.5–7.0%
Micro: ~3.5–5.0%
Mid-tier: ~2.5–3.5%
Macro: ~1.5–2.5%
Mega: ~0.9–1.5%
LinkedIn:
Nano/Micro: ~3.5–5.0%
Mid-tier: ~2.0–3.5%
Macro/Mega: ~1.0–2.0%
X (Twitter):
Nano/Micro: ~2.5–4.0%
Mid-tier: ~1.5–2.5%
Macro/Mega: ~0.8–1.5%
The TikTok nano-to-mega drop shows a substantial decline, which illustrates how dramatically tier affects your baseline. When you’re setting targets for a client or reporting to a stakeholder, always anchor the benchmark to the account’s current tier, not the platform average.
One important statistical note: these are medians, not means. ER distributions are heavily skewed by viral outliers.
How is engagement rate calculated? Formulas and worked examples
There are four formulas in regular use, and choosing the wrong one for your context is one of the most common reporting errors. Here’s when each applies.
The four core formulas:
ER by followers: (Total engagements ÷ followers) × 100. Use this for owned-account benchmarking and month-over-month tracking.
ER by reach: (Total engagements ÷ reach) × 100. Use this when evaluating content quality, since reach reflects who actually saw the post.
ER by impressions: (Total engagements ÷ impressions) × 100. LinkedIn’s native metric; also useful for paid content analysis.
Engagements per view: (Total engagements ÷ video views) × 100. Standard for TikTok and YouTube Shorts performance.
Worked examples
ER by followers: A brand has 8,500 followers. A post receives 340 likes, 22 comments, and 18 saves (380 total engagements). ER = (380 ÷ 8,500) × 100 = 4.47%. That’s strong for an Instagram mid-nano account.
ER by reach: The same post reached 2,100 unique accounts. ER by reach = (380 ÷ 2,100) × 100 = 18.1%. This higher number reflects how well the content resonated with people who actually saw it, not the full follower base.
ER by impressions: A LinkedIn post receives 95 reactions, 14 comments, and 8 shares (117 total engagements) on 4,800 impressions. ER = (117 ÷ 4,800) × 100 = 2.44%. That sits right at LinkedIn’s 2026 median.
Engagements per view (TikTok): A TikTok video gets 12,000 views, 480 likes, 35 comments, and 60 shares (575 total). ER = (575 ÷ 12,000) × 100 = 4.79%. Above the 4.25% platform median.
Building a simple ER tracker in Google Sheets
Pull your data from each platform’s native analytics API or export. Set up columns for: post date, platform, post type, followers at time of post, reach, impressions, likes, comments, shares, saves, and total engagements. Add formula columns for each ER type. Use a 30-day rolling average to smooth out single-post spikes. Google Sheets’ AVERAGE function across a filtered date range handles this cleanly. For Instagram, Meta’s Graph API provides reach and impressions at the post level. For LinkedIn, the Marketing API returns impression and engagement data per post. TikTok’s Display API gives view counts and engagement breakdowns.
What posting frequency and content formats correlate with higher engagement in 2026?
Cadence and format are two of the most controllable levers you have. The data doesn’t point to a single magic number for posting frequency, but it does show clear patterns worth building into your content calendar.
On Instagram, accounts posting 3–5 times per week tend to maintain higher average ER than those posting daily. Daily posting often dilutes engagement because each post competes with the last for the same audience’s attention. On TikTok, the opposite pattern holds: higher posting frequency (5–7 times per week or more) correlates with stronger reach and engagement because the algorithm rewards consistency and gives each video an independent distribution shot. LinkedIn favors quality over volume; 2–4 posts per week is a common sweet spot, with longer-form posts and document carousels consistently outperforming short text updates. Facebook organic reach is so compressed that frequency matters less than content type; video and link posts perform differently, and testing is the only reliable guide.
Hootsuite’s format analysis finds that posts generating mid-length comments tend to see materially higher engagement on average. That’s a useful signal: if your posts are getting one-word reactions rather than genuine responses, the content isn’t sparking conversation, regardless of what the ER number says.
Format performance observations
Short-form video (Reels, TikTok, YouTube Shorts) consistently outperforms static images and text posts on reach-adjusted ER. Carousels on Instagram and LinkedIn tend to earn higher saves and swipe-through rates than single images, which boosts ER without requiring viral reach. Long-form video on YouTube rewards watch time over raw engagement percentage, so ER is a secondary metric there. For content format ideas that map to these patterns, the format mix matters as much as the posting schedule.
Track ER by reach, not by followers, so you isolate content performance from audience growth effects.*
Why do benchmark reports disagree, and how do you pick the right one?
The short answer is that two reports can both be accurate and still show very different numbers, because they’re measuring different things. Before you use any benchmark, run through this checklist.
Methodology checklist:
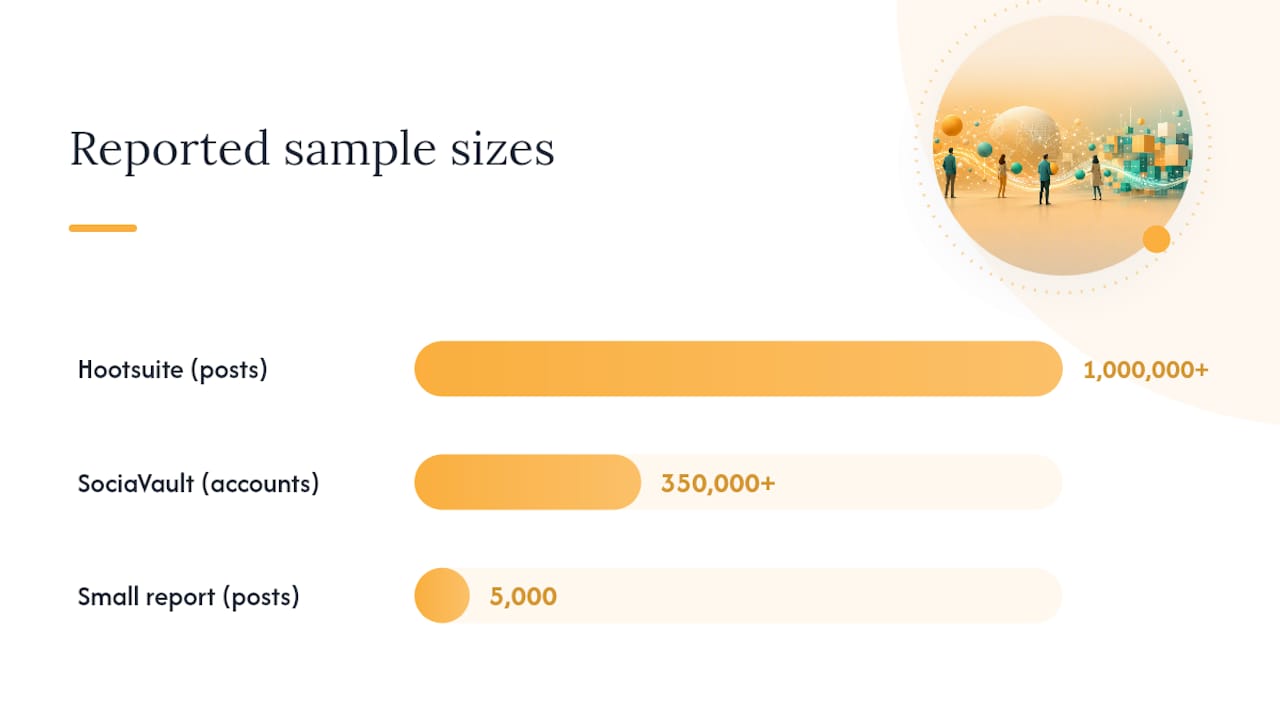
Sample size: Is it disclosed? Hootsuite analyzed over 1 million posts; SociaVault used 350,000+ accounts. A report based on 5,000 posts in one industry is not a cross-platform benchmark.
Date range: Does the data cover a full calendar year or a single quarter? Seasonal spikes in Q4 (retail, hospitality) can inflate annual averages if the sample skews toward that period.
Engagement definition: Does the report count clicks, saves, and shares, or only likes and comments? LinkedIn’s click-inclusive definition produces higher ERs than a reactions-only count.
Bot cleaning: Has the sample been filtered for fraudulent engagement? Reports that don’t disclose this are likely including inflated accounts. Cleaning for bots raises the reported median slightly because it removes artificially high outliers.
Median vs. mean: Median is more reliable for skewed distributions. A single viral post can pull a mean far above what a typical post achieves. SociaVault’s methodology uses medians specifically because ER distributions are heavily right-skewed.
On choosing a benchmark source: “Use platform-specific medians from large-sample, bot-cleaned reports for owned-account health checks. For influencer campaign evaluation, prioritize tier-matched medians from the same platform. For longitudinal tracking, pick one source and stick with it — switching vendors mid-year introduces methodology variance that looks like performance change.”
SocialRails’ 2026 aggregation is useful precisely because it compiles multiple vendor reports and surfaces where they agree and diverge. When vendors agree on a range, that range is more reliable.
For quick health checks, use platform medians from a large-sample source. For influencer campaign evaluation, use tier-matched medians. For longitudinal tracking, commit to one methodology and don’t switch sources mid-reporting cycle.
How do you apply 2026 benchmarks to real reporting targets?
Benchmarks are only useful when they translate into specific, account-level targets. Here’s a step-by-step process for doing that.
Identify your platform and current follower tier. Pull your current follower count and match it to the nano/micro/mid/macro/mega tiers above.
Find the tier-matched platform median. Use the tier tables in the follower section of this article. This is your baseline, not the overall platform average.
Adjust for industry. If your industry runs 20–30% below the platform median (financial services, healthcare), set your target at the industry-adjusted range, not the raw platform median.
Set a 90-day target range. A realistic lift for an account with no recent optimization is 10–20% above your current 30-day average ER. Don’t target the platform median if you’re currently at half of it; target a 15% improvement first.
Identify two or three levers to test. Format mix, posting cadence, and CTA type are the highest-impact variables. Pick one per 30-day sprint.
Define your measurement formula and stick with it. Decide upfront whether you’re tracking ER by followers or by reach, and don’t switch mid-test.
Sample 90-day targets by tier
Nano account (Instagram, retail): Current ER 3.8% → target 4.3–4.8% by week 12.
Micro account (LinkedIn, B2B/tech): Current ER 2.1% → target 2.4–2.8% by week 12.
Mid-tier account (TikTok, entertainment): Current ER 3.2% → target 3.6–4.0% by week 12.
For a fuller playbook on how to improve social media engagement beyond benchmark-setting, the tactical steps matter as much as the targets themselves.
Which levers move ER and by how much?
Format shift to short-form video: Typically the highest-impact change for Instagram and TikTok; can lift ER by 20–40% relative to a static-image baseline.
Carousel posts on LinkedIn: Consistently outperform single-image posts; document carousels in particular tend to earn higher save and share rates.
Posting time optimization: Smaller but reliable lift; posting at peak audience times can improve reach-adjusted ER by 10–15%.
CTA in caption: Posts with a direct question or explicit call to comment tend to generate more comments, which raises ER disproportionately since comments are weighted more heavily by most algorithms.
Engagement with comments within the first hour: Responding quickly signals activity to the algorithm and can extend a post’s distribution window.
How have engagement rates trended leading into 2026?
The broad trend over the past three years has been gradual compression on most platforms, with one notable exception. Facebook organic ER has declined steadily as the platform has shifted toward paid distribution and Reels-dominated feeds. Instagram feed ER has also compressed, though Reels partially offset that by giving organic content a wider non-follower distribution window. LinkedIn has held relatively steady, benefiting from lower content saturation compared to consumer platforms.
TikTok is the outlier. Its median ER has remained materially higher than other platforms, sustained by an algorithm that distributes content based on engagement signals rather than follower relationships. That structural advantage is unlikely to disappear in 2026, though increased content volume on the platform is gradually compressing its median from the peaks seen in 2021–2022.
The practical implication for 2026 planning: don’t use benchmarks from 2022 or 2023 as your baseline. Platform medians have shifted enough that a “good” Instagram ER from three years ago may now represent an above-average result. Anchor your targets to current-year data, and treat year-over-year changes in your own account’s ER as a signal worth investigating before attributing it to performance changes.
How do audience demographics affect engagement rate norms?
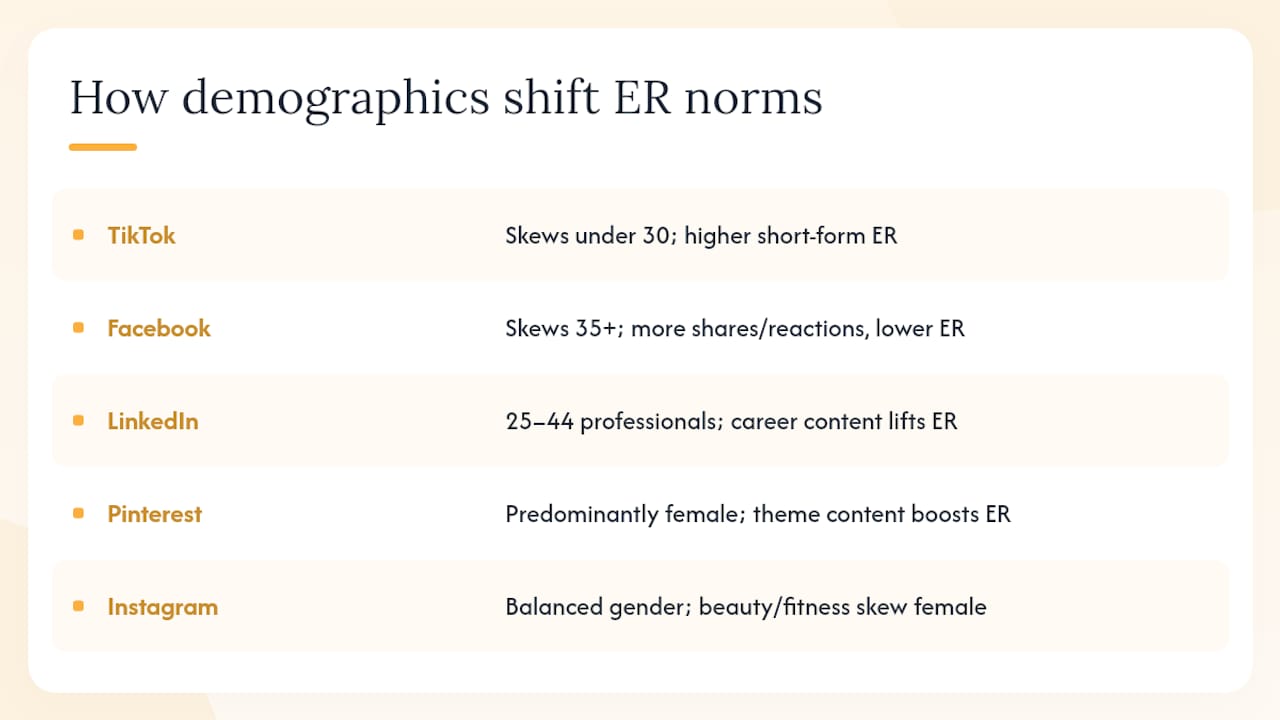
Demographics shape engagement behavior in ways that don’t always show up in platform-level averages. Pew Research’s 2025 U.S. social media data provides the clearest picture of platform adoption by age group, and those adoption patterns directly affect what ER you should expect when your audience skews younger or older.
TikTok’s user base skews significantly younger, with the highest adoption rates among adults under 30. That age group tends to engage more actively with short-form video content, which partly explains TikTok’s higher platform median. Facebook’s user base has aged upward over the past decade; its audience now skews toward adults 35 and older, who tend to engage differently (more shares and reactions, fewer comments) and at lower overall rates on organic content.
LinkedIn’s engagement patterns reflect its professional audience. Content that addresses career development, industry news, or professional skills tends to earn stronger engagement from the 25–44 age segment that dominates the platform. Posts that feel out of place in a professional context, regardless of quality, consistently underperform.
Gender also plays a role, though it’s more platform-specific than age. Pinterest’s audience is predominantly female in the U.S., and content aligned with that audience’s interests (home, fashion, food, wellness) earns significantly higher ER than off-theme content. Instagram’s audience is more balanced by gender, but beauty, fitness, and lifestyle content still skews toward female engagement patterns. When your audience demographics differ from a platform’s typical composition, adjust your benchmark expectations accordingly rather than treating the platform median as your target.
How are 2026 algorithm changes affecting engagement benchmarks?
Algorithm updates in 2026 have continued a trend that’s been building for several years: platforms are increasingly rewarding content that keeps users on the platform rather than content that drives off-platform clicks. This shift has specific implications for how you interpret and target engagement rates.
Instagram’s 2026 algorithm updates have placed greater weight on saves and shares relative to likes, reflecting the platform’s push toward content that users find worth returning to. If your ER is holding steady but your save rate is declining, that’s a warning sign that the algorithm may reduce your distribution even if the raw percentage looks fine.
TikTok’s algorithm continues to prioritize watch time and completion rate as primary signals, with engagement rate as a secondary factor. A post with strong completion but moderate ER will typically outperform a post with high ER but low completion in terms of distribution. This means TikTok ER benchmarks should always be read alongside completion rate data.
LinkedIn’s 2026 updates have favored content that generates comments over content that generates reactions alone. A post with 10 comments and 50 reactions will typically outperform a post with 200 reactions and 2 comments in terms of algorithmic distribution. That’s a meaningful shift for B2B marketers who have historically optimized for reaction counts.
Facebook’s algorithm continues to prioritize Reels and video content in organic distribution, which means static posts are increasingly dependent on paid amplification to reach meaningful audience segments. For brands relying on organic Facebook reach, this makes ER a less actionable metric without a corresponding reach strategy.
Do engagement rates vary within industries by content theme?
They do, and the variance within an industry can be as large as the variance between industries. Luxury retail and mass retail both fall under the retail/consumer goods category, but their engagement dynamics are quite different.
Luxury retail accounts typically post less frequently, with higher production quality and a stronger emphasis on aspirational imagery. Their audiences tend to be smaller and more intentional, which produces higher ER percentages.
Mass retail accounts operate at higher volume and broader reach, which compresses ER.
Within healthcare, the gap between wellness and fitness content (which performs more like lifestyle content) and clinical or pharmaceutical content (which faces strict compliance constraints) is significant.
In B2B/tech, thought leadership content from individual executives consistently outperforms brand page content on LinkedIn. If you manage a B2B brand, employee advocacy and executive content are worth tracking separately from brand page benchmarks.
For education, the difference between K–12 content (which performs well on Facebook and Instagram with parent audiences) and higher education content (which performs better on LinkedIn and Instagram with prospective student audiences) is large enough to warrant separate benchmark targets for each content pillar.
Benchmarking in practice: platform-industry examples
Abstract benchmarks become useful when you apply them to a specific account situation. Here are three scenarios that illustrate how the numbers work in practice.
Scenario 1: A mid-size nonprofit on Instagram. The account has 18,000 followers (micro tier) and posts 4 times per week. The account is performing below its industry-tier benchmark, which points to a content-mix or posting-time issue rather than an audience problem. The next diagnostic step is to check whether posts with mission-driven storytelling outperform informational posts, and whether posting time aligns with when the audience is most active.
Scenario 2: A B2B software company on LinkedIn. The company page has 12,000 followers (micro tier) and posts 3 times per week. The account is at the low end of its range. The most likely lever is content type: if the majority of posts are product announcements rather than thought leadership or industry commentary, shifting the content mix toward the latter typically lifts ER on LinkedIn.
Scenario 3: A regional restaurant group on TikTok. The account has 4,200 followers (nano tier) and posts 5 times per week. The account is performing at the lower end of its expected range, but the gap is small. Given TikTok’s algorithm, the most productive experiment is increasing posting frequency to 7 times per week for 30 days and tracking whether reach-adjusted ER holds or improves.
These scenarios illustrate a consistent principle: benchmarks tell you where to look, not what to fix. The diagnostic work comes after you’ve established whether you’re above, at, or below your tier-and-industry-adjusted target.
What benchmarks actually mean for small-business social media
Most benchmark guides are written for enterprise marketing teams with dedicated analysts and multi-platform budgets. The reality for small businesses is different, and the numbers need to be interpreted with that context in mind.
A small retail business with 2,000 Instagram followers should not be comparing itself to a platform-wide median that includes accounts with 500,000 followers.
At SOL Social Media, we apply tier-matched, industry-adjusted benchmarks when evaluating client accounts, not platform averages. A healthcare practice in the mid-Atlantic region with 3,500 Instagram followers has a different baseline than a national consumer brand with 350,000 followers, and treating them the same way produces bad strategy. The benchmark is only as useful as the specificity you bring to it.
The other thing we see consistently: small businesses tend to undervalue comment quality as an engagement signal. A post with 12 thoughtful comments from real customers is a stronger performance indicator than a post with 200 likes and no conversation. Algorithms increasingly agree with that assessment, which means investing in content that sparks genuine dialogue is both a brand-building and an algorithmic strategy.
SOL Social Media helps you turn benchmarks into results
Reading benchmarks is one thing. Knowing what to do with them for your specific account, industry, and audience is where the real work happens.
SOL Social Media provides social media engagement services built specifically for small businesses, from full-service content management and monthly content planning to social media audits that show you exactly where your engagement stands relative to your tier and industry. We don’t hand you a generic report. We build a strategy grounded in your goals, your audience, and the metrics that actually matter for your business.
If you’re a nonprofit or community-focused organization, our community involvement programs offer additional support for mission-driven social media strategy. For businesses ready to move from benchmarks to a real content plan, reach out to SOL Social Media for a social media audit and see where your engagement stands today.
Sources
The primary sources behind the benchmarks in this article:
FAQ
What is a good engagement rate on social media in 2026?
An engagement rate within a moderate range is generally considered good across most platforms in 2026, though the right target depends on your platform, follower tier, and industry.
Why is my TikTok engagement rate higher than my Instagram rate?
The ~2.3× gap between the two platforms is structural and consistent across follower tiers.
Should I use median or mean when comparing my engagement rate to benchmarks?
Use median. ER distributions are heavily skewed by viral outliers, and a single high-performing post can pull a mean far above what a typical post achieves. Reputable benchmark reports from sources like SociaVault use medians for this reason.
How do I set a realistic engagement rate target for my account?
Does posting frequency affect engagement rate?
Yes, but the relationship varies by platform. On TikTok, higher frequency (5–7+ posts per week) tends to support stronger reach and engagement. On Instagram, 3–5 posts per week typically outperforms daily posting, which can dilute engagement per post.
Recommended
Comments