


Social Media KPIs That Drive Real Business Results

Start with five numbers, and you’ll know more about your social media performance than most businesses ever do. The social media KPIs that matter most right now are engagement rate, audience growth rate, click-through rate (CTR), conversion rate, and return on ad spend (ROAS) or revenue from social. Each one connects directly to a business outcome, not just a platform stat.
Here’s the fast verdict on each:
Engagement rate (likes + comments + shares + saves ÷ reach × 100): measures whether your content actually resonates. Tied to brand awareness and audience quality.
Audience growth rate (net new followers ÷ total followers × 100): tracks whether your brand is expanding its reach over time. Tied to top-of-funnel growth.
Click-through rate (clicks ÷ impressions × 100): shows how well your content moves people from passive viewing to active interest. Tied to traffic and lead generation.
Conversion rate (conversions ÷ clicks × 100): the clearest signal that social is driving real business actions, whether that’s a purchase, a form fill, or a booked appointment. Tied directly to revenue.
ROAS / revenue from social (revenue ÷ ad spend): the metric leadership actually cares about. Tracked through GA4 and your ads manager. Tied to budget justification and growth.
Tools like GA4, Hootsuite, and Brandwatch all treat these five as the foundation of any credible measurement program. The sections below show you exactly how to set them, track them, and turn them into decisions.
KPI | Best For | One-Line Definition |
Engagement rate | Content quality, brand awareness | Interactions divided by reach, expressed as a percentage |
Audience growth rate | Top-of-funnel expansion | Net new followers as a percentage of total followers |
Click-through rate | Traffic, lead generation | Clicks divided by impressions, expressed as a percentage |
Conversion rate | Revenue, lead capture | Conversions divided by clicks, expressed as a percentage |
ROAS / revenue from social | Budget justification, ROI | Revenue generated per dollar of ad spend |
Promote a KPI from tactical to strategic when it meets at least one of these conditions:
Leadership is asking for proof of social’s business contribution
The metric has a direct dollar value you can calculate or model
It has moved consistently in one direction for three or more reporting periods
It maps to a company-level objective (customer acquisition, retention, revenue growth)
Key Takeaways
Choosing the right social media KPIs, setting SMART targets, and reviewing them on a consistent cadence is what separates social media programs that grow businesses from those that only generate reports.
Point | Details |
Pick KPIs by objective | Choose 2–5 KPIs per business goal; tie each to awareness, engagement, traffic, or revenue. |
Set SMART targets with baselines | Pull 30–90 days of historical data before setting any target; a baseline makes the goal real. |
Use UTMs and GA4 together | Every social link needs a UTM tag so GA4 can attribute conversions and revenue accurately. |
Review weekly, report monthly | Operational KPIs (CTR, engagement rate) need weekly checks; ROI and growth metrics belong in monthly reports. |
SOL Social Media for managed KPI tracking | SOL Social Media audits your measurement setup and runs KPI-driven campaigns for small businesses. |
What are social media KPIs, and how do they differ from metrics?
A social media KPI is a metric that has been deliberately tied to a business objective, given a target, and assigned a timeframe. That three-part structure is what separates a KPI from a raw metric. Brandwatch defines it clearly: a metric only becomes a KPI when it measures progress toward a defined business goal. Without the goal and the target, you have data. With them, you have a decision tool.
The practical difference matters more than the definition. Raw metrics tell you what happened. KPIs tell you whether what happened was good enough.
KPI vs. metric: the key differences
A metric is any measurable value the platform reports: impressions, likes, follower count, video views.
A KPI is a metric with a business objective attached, a target set, and a reporting cadence defined.
Metrics are infinite. KPIs should be limited to 2–5 per objective so they stay actionable.
Metrics live in dashboards. KPIs belong in leadership reports and strategy reviews.
A metric can be interesting. A KPI must be decision-driving.
To see why this matters in practice, consider a single Instagram campaign. The raw metric view looks like this: 4,200 likes, 180 comments, 12,000 impressions. Looks solid. But none of those numbers tell you whether the campaign moved the business forward. Remapped as KPIs, the same campaign reads differently: engagement rate of 3.6% against a 3% target (green), CTR of 0.8% against a 1.2% target (red), and zero tracked conversions against a goal of 15 trial sign-ups (critical). The campaign felt like a win on vanity metrics and was actually underperforming on every business outcome. That’s the gap KPIs close.
Hootsuite groups social media KPIs into six categories: engagement, awareness, conversions, ROI, customer care, and content performance. That structure is useful because it forces you to ask which business outcome each metric is actually serving before you call it a KPI.
Pro Tip: Before adding any metric to your KPI list, ask: “If this number improves, does revenue, retention, or reach improve with it?” If you can’t draw a direct line, it’s a metric, not a KPI.
How do you set social media KPIs that actually prove value?
The process takes one sentence to summarize: align a business objective to 2–5 measurable social outcomes, set a SMART target for each, establish your baseline, choose your attribution method, and assign a reporting cadence and owner. Everything else is execution.
Here’s the step-by-step:
Identify the business objective. Start with what the company needs: more customers, higher retention, lower cost per lead, or greater brand awareness. Every KPI you choose must trace back to one of these.
Select 2–5 KPIs per objective. More than five and you lose focus. Hootsuite’s goal-setting guidance recommends mapping 2–3 KPIs per objective and reviewing them quarterly. Fewer KPIs, sharper decisions.
Establish your baseline. Pull the last 30–90 days of data for each chosen metric. Without a baseline, your target is a guess.
Set SMART targets. Each target should be Specific, Measurable, Achievable, Relevant, and Time-bound. “Increase engagement rate from 2.1% to 3.0% on Instagram by the end of Q3” is a SMART target. “Improve engagement” is not.
Choose your attribution method. Decide whether you’re using last-click, first-touch, or multi-touch attribution in GA4 before you launch. Changing attribution models mid-campaign invalidates your comparisons.
Assign a reporting cadence and owner. Weekly for operational KPIs (CTR, engagement rate). Monthly for growth KPIs (audience growth rate, conversion rate). Quarterly for ROI and revenue metrics. One person owns each KPI report.
SMART goal template:
“Increase [KPI] from [baseline] to [target] on [platform] by [date], tracked via [tool].”
Example: “Increase LinkedIn CTR from 0.6% to 1.0% on sponsored posts by September 30, tracked via LinkedIn Campaign Manager and GA4.”
Which KPIs should you track for each social media objective?
KPIs should be chosen by objective first, platform second. Picking metrics because they’re easy to find in a dashboard is how teams end up reporting impressions to a CEO who wants to know about revenue. Socialinsider recommends building KPI stacks by objective and presenting only business-outcome KPIs to leadership, keeping activity metrics in operational dashboards.
Awareness KPIs
Engagement KPIs
Engagement rate formula: (Likes + Comments + Shares + Saves) ÷ Reach × 100
Platform benchmarks vary. Brandwatch cites Rival IQ data as a starting point: Instagram typically runs higher than Facebook and LinkedIn, while TikTok engagement rates can outpace both for accounts with strong content-format fit. Use these as directional guides, not hard rules, since your own baseline is the most reliable benchmark you have.
For small businesses, Later specifically highlights saves-to-reach ratio and profile visits as high-signal organic metrics that tell you far more about content quality than raw like counts.
Traffic and conversion KPIs
CTR formula: Clicks ÷ Impressions × 100 Conversion rate formula: Conversions ÷ Clicks × 100
KPI | Formula | When to use | How to track | Benchmark direction | Business outcome |
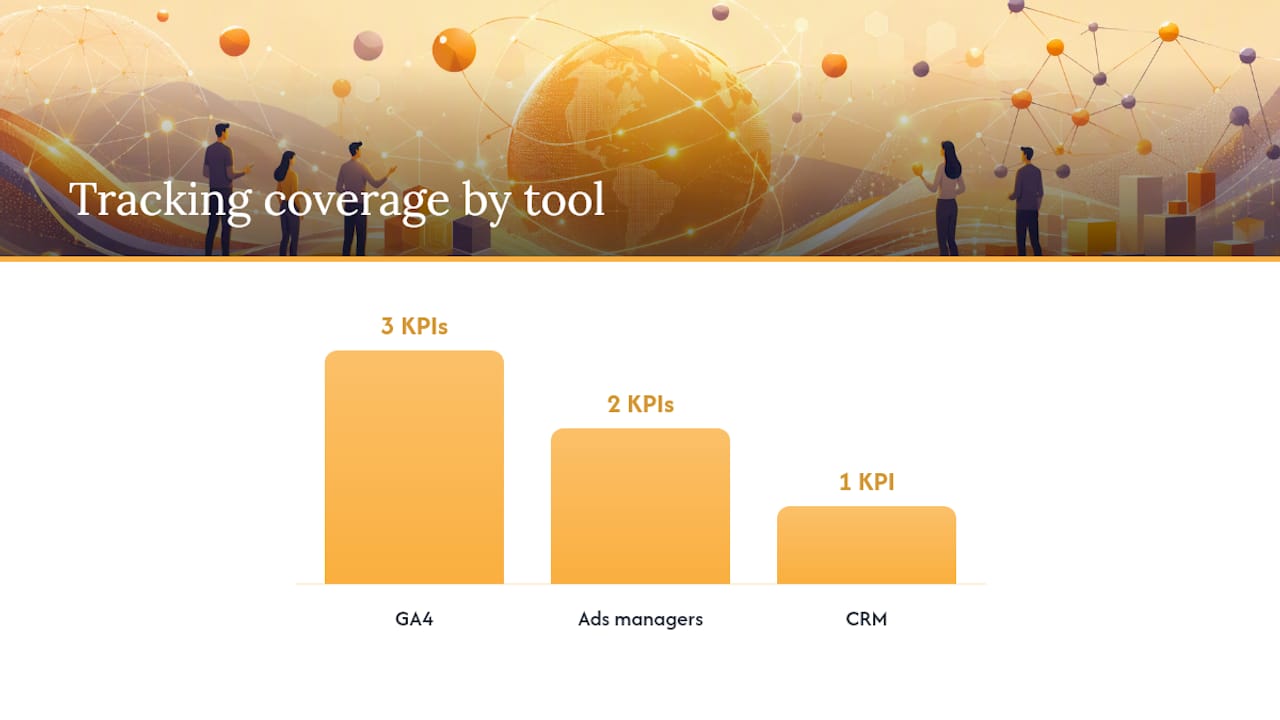
Click-through rate | Clicks ÷ Impressions × 100 | Link posts, paid ads, bio links | GA4, ads managers | Increase | Traffic, lead gen |
Conversion rate | Conversions ÷ Clicks × 100 | Lead gen, ecommerce, appointments | GA4 with UTMs | Increase | Revenue, leads |
Cost per click (CPC) | Ad spend ÷ Clicks | Paid campaigns | Ads managers | Decrease | Efficiency |
Cost per lead (CPL) | Ad spend ÷ Leads | Lead-gen campaigns | GA4, CRM | Decrease | Acquisition cost |
Audience KPIs
Audience growth rate formula: (Net new followers ÷ Total followers at start of period) × 100
Customer care KPIs
KPI | Formula | When to use | How to track | Benchmark direction | Business outcome |
Response rate | Replies ÷ Incoming messages × 100 | Service-heavy brands, healthcare | Sprout Social, Hootsuite | Increase | Retention, trust |
Average response time | Total response time ÷ Number of responses | Customer service quality | Sprout Social | Decrease | Satisfaction |
Sentiment score | Positive mentions ÷ Total mentions × 100 | Brand health monitoring | Brandwatch, Semrush | Increase | Brand reputation |
For healthcare social media KPIs specifically, response rate and sentiment score carry extra weight because patient trust is directly tied to how quickly and professionally a practice engages online.
Revenue and ROI KPIs
Vanity vs. value: Impressions, follower count, and raw likes are metrics, not KPIs, unless they’re tied to a specific target and business outcome. Engagement rate, CTR, conversion rate, and ROAS are the metrics most likely to earn a seat in a leadership report.
KPI stacks by objective:
Awareness campaign: Reach + Video view rate + Audience growth rate
Engagement campaign: Engagement rate + Saves-to-reach ratio + Comments per post
Lead generation: CTR + Conversion rate + CPL
Ecommerce: ROAS + Revenue from social + Conversion rate
Customer care: Response rate + Average response time + Sentiment score
How do you measure social media KPIs with the right tools?
The minimum data infrastructure you need is four things: in-platform analytics, GA4 with UTM tagging, your ads manager, and one aggregation tool. Each serves a distinct role, and skipping any one of them creates blind spots.
Why each source is necessary:
In-platform analytics (Instagram Insights, LinkedIn Analytics, TikTok Analytics, Facebook Insights) give you native engagement data that no third-party tool captures with full accuracy.
GA4 tracks what happens after the click: sessions, conversions, revenue, and user behavior on your website. Without GA4, you can’t connect social activity to business outcomes.
UTM tagging is the bridge between platform data and GA4. Every link you post on social should carry a UTM string so GA4 can attribute traffic and conversions to the right channel, campaign, and post.
Ads managers (Meta Ads Manager, LinkedIn Campaign Manager, TikTok Ads Manager) provide cost data, ROAS, and paid-specific KPIs that platform analytics don’t always surface cleanly.
The four tools that do the most work
Google Analytics 4 (GA4) is the non-negotiable foundation for any business that wants to connect social to revenue. Set up conversion events (form submissions, purchases, appointment bookings) and use the Traffic Acquisition report to see exactly how much revenue or how many leads each social channel is generating. GA4’s attribution models let you compare last-click vs. data-driven attribution, which matters when social is part of a longer buyer journey.
Hootsuite handles scheduling, cross-platform publishing, and consolidated reporting. Its analytics layer pulls data from multiple platforms into one view, which saves significant time when you’re managing three or more channels. It’s particularly useful for tracking engagement rate and audience growth rate across platforms without logging into each one separately.
Sprout Social goes deeper on customer care KPIs than most tools. Its Smart Inbox consolidates messages, comments, and mentions, and its reporting suite surfaces response rate and average response time alongside engagement and reach data. For businesses where social serves a customer service function, Sprout Social is the clearest choice.
Semrush brings competitive intelligence into the KPI picture. Its Social Media Tracker shows share of voice, competitor engagement rates, and content performance benchmarks that help you contextualize your own numbers. When your engagement rate drops, Semrush can tell you whether it’s an industry-wide trend or a signal specific to your account.
For a broader look at analytics tools beyond these four, this roundup of social media analytics tools covers additional options worth considering.
Measurement setup checklist
Create a UTM naming convention and document it. Example: utm_source=instagram&utm_medium=social&utm_campaign=q3-launch&utm_content=carousel-post-1. Consistency here is what makes GA4 data trustworthy.
Set up GA4 conversion events for every action that maps to a business KPI: form submissions, purchases, phone call clicks, appointment bookings.
Connect your ad accounts to GA4 via Google Ads linking (for Meta and others, use UTMs since direct integration is limited).
Build a GA4 Exploration report filtered by social traffic source to see conversions and revenue by channel.
Schedule weekly data pulls from each platform’s native analytics for engagement and reach data.
Sync platform data into a central dashboard using Hootsuite, Sprout Social, or a Google Looker Studio template connected to GA4.
Weekly checks: Review CTR and engagement rate by post. Flag any post with CTR below your baseline. Check conversion events in GA4 to confirm tracking is firing correctly. Note any sudden drops in reach, which often signal algorithm changes or posting frequency issues.
How do you set realistic benchmarks and structure your reporting?
Translate your baseline into a target by applying a realistic improvement percentage, typically 10–20% above your current average for a 90-day period, unless you’re launching a new channel or campaign type where no baseline exists. In that case, use industry benchmark ranges as a starting point and recalibrate after the first 30 days.
Platform benchmark ranges (directional starting points)
Platform | Engagement rate range | Notes |
1%–5% | Reels typically outperform static posts | |
TikTok | 4%–8% | Highly variable by niche and content format |
0.5%–2% | B2B content; lower volume, higher intent | |
0.5%–1.5% | Organic reach has declined significantly | |
X (Twitter) | 0.5%–1% | Impressions-heavy; lower engagement rates typical |
These ranges draw from Brandwatch’s platform benchmark guidance. Use them as a floor, not a ceiling. Your own historical data, once you have 60–90 days of it, is always the more reliable reference.
Reporting cadence
Weekly reports are operational. They go to the social media manager or marketing team and cover: top-performing posts by engagement rate, CTR by channel, any conversion tracking anomalies, and a quick note on what to test next week. Keep these to one page or one dashboard view.
Monthly reports go to marketing leadership. They cover: audience growth rate, total conversions from social, CPL or CPA trends, and a comparison to the prior month and the target. This is where you surface whether KPIs are on track and flag anything that needs a strategy adjustment.
Quarterly reports go to executives or business owners. They cover: social media ROI, revenue from social, year-over-year growth on key KPIs, and budget efficiency metrics like ROAS and CPL. Gartner’s 2025 CMO spend survey found that marketing budgets have flatlined at approximately 7% of company revenue. This means every quarterly report needs to show clear business impact or risk budget cuts.
Lean report template
Report level | Audience | KPIs to include | Format |
Weekly | Social/marketing team | Engagement rate, CTR, top posts, conversion events | Dashboard or one-page summary |
Monthly | Marketing leadership | Audience growth rate, conversions, CPL, CPA | Slide deck or PDF report |
Quarterly | Executives, business owners | ROI, revenue from social, ROAS, YoY KPI trends | Executive summary with charts |
What to surface for leadership vs. operations:
Leadership wants three numbers: revenue or leads from social, cost per acquisition, and ROI. Give them those first, then offer the supporting detail.
Operations teams need post-level data: which content formats are driving CTR, which days and times produce the highest engagement rate, and which campaigns are converting.
How do you calculate social media ROI?
Shopify’s ROI methodology gives the clearest formula: (Earnings − Costs) ÷ Costs × 100 = Social Media ROI %. The challenge isn’t the math. It’s defining “earnings” and “costs” accurately enough that the number means something.
For a deeper breakdown of what to include in each side of that equation, this guide to measuring social media ROI walks through the full process.
Step-by-step ROI calculation
Define your objective and the value per action. For ecommerce, use average order value (AOV). For lead gen, use customer lifetime value (CLV) multiplied by your close rate. For awareness campaigns, use modeled values (cost per equivalent PR impression, for example).
Track earnings through GA4. Enable ecommerce tracking or goal value assignment in GA4 so every conversion from social has a dollar value attached.
List all costs. Include: ad spend, content production (photography, video, copywriting), tool subscriptions, and agency or labor costs. A clear breakdown of social media marketing costs can help you build a complete cost inventory.
Apply the formula. (Total earnings from social − Total costs) ÷ Total costs × 100.
Interpret the result. A positive ROI means social is generating more value than it costs. A negative ROI means either your costs are too high, your conversion rate is too low, or you’re measuring the wrong outcomes.
Worked example: ecommerce
A small online retailer runs a 30-day Instagram and Facebook campaign. GA4 ecommerce tracking shows $8,400 in revenue attributed to social traffic. Total costs: $1,200 in ad spend, $600 in content production, $200 in tool costs. Total costs = $2,000.
ROI = ($8,400 − $2,000) ÷ $2,000 × 100 = 320%
Worked example: lead generation
A B2B service business runs LinkedIn sponsored content for 60 days. GA4 tracks 45 form submissions from social. The business closes 20% of leads, and CLV is $3,500. Estimated earnings = 45 × 0.20 × $3,500 = $31,500. Total costs: $2,500 ad spend, $800 content, $300 tools = $3,600.
ROI = ($31,500 − $3,600) ÷ $3,600 × 100 = 775%
ROI cost checklist: Ad spend, content production (design, video, copywriting), tool and platform subscriptions, agency or freelancer fees, and internal labor time (hours × hourly rate). Missing any one of these understates your true cost and overstates ROI.
Combining direct ecommerce tracking in GA4 with modeled values for engagement-driven outcomes, as Shopify’s guidance recommends, gives you the most complete picture of what social is actually worth to your business.
What KPI mistakes are quietly distorting your results?
The most damaging measurement errors aren’t the obvious ones. They’re the ones that make your reports look clean while your decisions drift further from reality. Here are the four that cause the most harm, and how to fix each one.
Chasing vanity metrics. Follower count, raw impressions, and total likes feel like progress. They rarely are. A follower count that grows 500% while CTR stays flat means you’re attracting an audience that doesn’t act. Tie every metric you report to a business outcome, or drop it from your KPI list.
Inconsistent definitions across platforms. “Engagement” means different things on Instagram (likes + comments + saves + shares), LinkedIn (reactions + comments + reposts + clicks), and TikTok (likes + comments + shares + video completions). If you’re comparing engagement rates across platforms without normalizing the formula, you’re comparing apples to spreadsheets. Document your formula for each platform and apply it consistently.
Mixing paid and organic without labeling. Blending paid and organic data in a single engagement rate or reach figure makes both look better than they are. Always segment paid and organic in your reporting. Later specifically recommends separating organic from paid analytics for small businesses, where the distinction is especially easy to lose track of.
Weak attribution. If you’re not using UTM tags on every social link, GA4 is attributing a portion of your social traffic to “direct” or “other.” That means your social ROI is understated and your direct traffic looks inflated. Implement a UTM naming convention and audit it monthly.
Red flags to watch for in your dashboards:
Sudden follower spikes with no corresponding increase in engagement rate (often bots or low-quality follows from paid promotion)
High impressions with near-zero clicks (content is being served but not resonating; check your creative and copy)
Conversion events spiking without a corresponding increase in social traffic (tracking may be misfiring)
Engagement rate rising while reach falls (algorithm is showing content to a smaller, more engaged core; may signal you need to broaden your content mix)
Quick fixes:
Standardize KPI definitions in a shared document and review it with your team quarterly
Create separate paid and organic views in every reporting dashboard
Audit UTM tags monthly using GA4’s Traffic Acquisition report
Validate conversion events weekly by checking GA4’s Realtime report after a test conversion
Pro Tip: Experienced measurement teams run a “definition audit” at the start of every quarter: they pull the same KPI from two different tools and compare the numbers. If Hootsuite and GA4 show materially different engagement rates for the same campaign, the discrepancy itself is the signal. Find the source of the gap before you report either number.
A ready-to-use KPI dashboard and one-month measurement plan
A well-built KPI dashboard does one thing: it shows you what to do next. Every column should answer a question, and every row should represent a decision point. The schema below gives you the structure; the one-month plan gives you the cadence.
Dashboard column schema (CSV-ready)
Column | What it captures |
Date | Reporting period (daily or weekly) |
Channel | Platform (Instagram, LinkedIn, TikTok, etc.) |
Campaign | Campaign name or content pillar |
Post ID | Platform-specific post identifier |
Impressions | Total times content was served |
Reach | Unique accounts that saw the content |
Clicks | Total link clicks |
CTR | Clicks ÷ Impressions × 100 |
Engagement rate | (Interactions ÷ Reach) × 100 |
Conversions | GA4-tracked conversion events |
Revenue | GA4 ecommerce or goal value |
Ad spend | Total paid spend for the period |
ROAS | Revenue ÷ Ad spend |
One-month measurement plan
Week 1: Baseline and setup. Pull 30-day historical data for all KPIs. Confirm UTM tags are live on all active links. Verify GA4 conversion events are firing. Document your KPI definitions and targets.
Week 2: First performance check. Compare CTR and engagement rate against baseline. Flag any posts with CTR below target. Check GA4 for conversion attribution. Note which content formats are outperforming.
Week 3: Optimization actions. Pause or adjust underperforming paid content. Double down on the content format with the highest engagement rate. Test one new creative variable (headline, image, CTA).
Week 4: Monthly report prep. Aggregate all KPI data into the dashboard schema. Calculate ROI for any paid campaigns. Prepare the monthly leadership summary: audience growth rate, conversions, CPL, and ROI. Set targets for the next 30 days based on what you learned.
Weekly checklist:
Review top 5 posts by engagement rate
Check CTR against target; flag anything below baseline
Confirm conversion events are tracking in GA4
Note any reach or impression anomalies
Update the dashboard with the week’s data
SOL Social Media configures client dashboards using this schema, with inputs required from clients including: GA4 access, UTM naming conventions already in use, a list of active conversion events, and ad account access for paid campaigns. The result is a dashboard that surfaces the 5–7 KPIs that actually drive decisions, with everything else available in a secondary view for operational use.
Two agency-tested tips for keeping dashboards low-noise:
Limit your primary dashboard to 7 KPIs maximum. Every additional metric increases the time it takes to find the signal.
Color-code KPI status (green/yellow/red against target) so the weekly review takes minutes, not hours.
How to segment KPI data for deeper insights
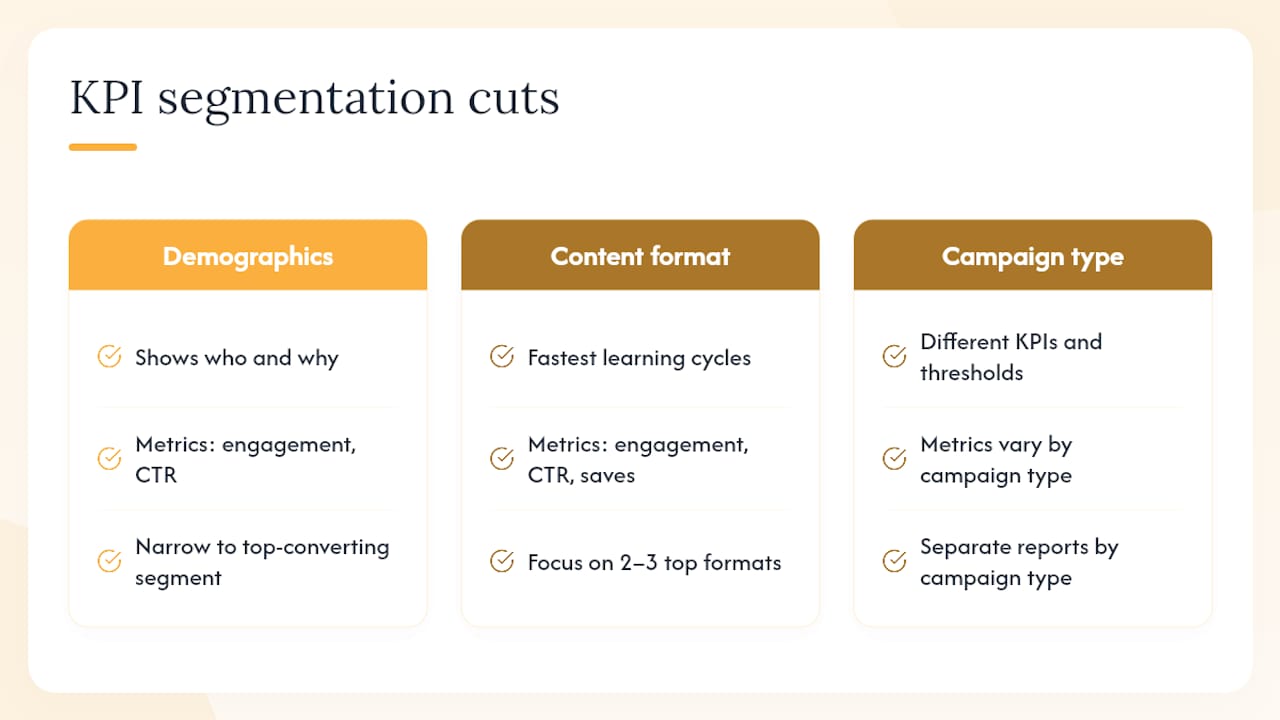
Aggregate KPI data tells you what happened. Segmented data tells you why, and who it happened for. The most useful segmentation cuts are by audience demographics, content format, and campaign type.
Audience demographic segmentation is available natively in Instagram Insights, Facebook Audience Insights, LinkedIn Analytics, and TikTok Analytics. Pull engagement rate and CTR by age group, gender, and location. If your highest-converting audience segment is 35–44-year-old women in a specific metro area but your content is optimized for a broader 25–54 demographic, you’re diluting your budget and your message. Narrowing your targeting to the converting segment typically improves both CTR and conversion rate without increasing spend.
Content format segmentation is where small businesses gain the fastest learning cycles. Track engagement rate, CTR, and saves-to-reach ratio separately for Reels, carousels, static images, Stories, and link posts. Most accounts find that two or three formats drive the majority of their KPI performance. Identifying those formats early and concentrating content production there is one of the highest-leverage moves in social media strategy.
Campaign type segmentation means separating brand awareness campaigns from lead-gen campaigns from retargeting campaigns in your reporting. Each has a different KPI stack and a different success threshold. A brand awareness campaign with a 0.3% CTR might be performing well. A retargeting campaign with the same CTR is almost certainly underperforming. Mixing them in a single report obscures both signals.
Pro Tip: When segmenting by demographics, always check whether your top-performing audience segment matches your actual customer profile. A mismatch between who engages most and who actually buys is one of the most common and most fixable attribution gaps in social media measurement.
How social media KPIs connect to your broader marketing performance
Social media KPIs don’t exist in isolation. They’re one layer in a broader marketing measurement system, and the most useful thing you can do is connect them to the metrics your CRM, email platform, and paid search campaigns are already tracking.
The connection point is the customer journey. A prospect might see a LinkedIn post (impression), click through to a landing page (CTR), download a lead magnet (conversion), receive a nurture email sequence, and close as a customer three weeks later. If your social KPIs stop at the click, you’re missing the downstream value that social created. Gartner identifies measurement and attribution as top CMO priorities entering 2026, precisely because this cross-channel attribution gap is where marketing budget decisions go wrong.
The practical fix is a shared UTM taxonomy across all channels. When your social UTMs, email UTMs, and paid search UTMs follow the same naming convention, GA4 can build a multi-touch attribution model that shows social’s true contribution to revenue, not just its last-click share. For a broader view of how to connect social performance to overall marketing ROI, this guide to measuring return on marketing investment covers the full attribution picture.
Three integration points that deliver the most clarity:
CRM integration: Connect GA4 conversion events to your CRM (HubSpot, Salesforce, or similar) so you can track which social-sourced leads actually close and at what value. This is what makes CLV-based ROI calculations accurate rather than estimated.
Email platform data: Compare social engagement rates to email open and click rates for the same audience segment. When both are declining together, the issue is usually message fatigue or audience fit, not channel performance.
Paid search cross-reference: If paid search conversion rates are rising while social conversion rates are flat, check whether your social content is driving branded search volume. Social often contributes to conversions that paid search closes, a contribution that last-click attribution misses entirely.
KPI decisions in action: three examples worth studying
Abstract KPI frameworks are easy to agree with. What actually changes behavior is seeing how a specific number triggered a specific decision. Here are three examples that illustrate the pattern.
A retail brand shifts budget based on format-level CTR
A small retail business was running a mix of static product images and short-form video on Instagram and Facebook. Monthly reporting showed overall social CTR of 0.7%, which looked acceptable against a 0.6% baseline. When the team segmented CTR by content format, the picture changed: static images were generating 0.4% CTR while short-form video was generating 1.4%. The aggregate number had been masking a 3.5x performance gap. The business reallocated 70% of its content production budget to video, and within 60 days, overall CTR climbed to 1.1%.
The decision wasn’t driven by a hunch about video trends. It was driven by a segmented KPI that made the right answer obvious.
A healthcare practice uses response rate to address a patient trust gap
A medical practice noticed that its social media follower count was growing steadily, but appointment bookings from social were flat. A review of customer care KPIs revealed a response rate of 34% on Facebook and Instagram messages, with an average response time of 18 hours. For a healthcare audience, that combination signals unreliability. The practice set a KPI target of 90% response rate within 4 hours, assigned a staff member to monitor the inbox daily, and used Sprout Social’s Smart Inbox to consolidate messages. Within 90 days, appointment bookings from social increased, and the practice’s sentiment score improved measurably. The follower count hadn’t been the problem. The response behavior was.
A B2B service firm recalibrates its LinkedIn strategy using CPL
A professional services firm was generating LinkedIn leads at a CPL of $220 through sponsored content. The sales team’s close rate on those leads was 12%, and average contract value was $8,000. That put the revenue-per-lead at $960 and ROI solidly positive. But when the firm segmented leads by job title, it found that leads from Director-level and above closed at 28%, while Manager-level leads closed at 4%. The CPL for both segments was nearly identical. By adjusting LinkedIn targeting to prioritize Director and above, the firm cut total lead volume by 30% but improved close rate to 22% overall, reducing effective CPL from $220 to under $140 on a revenue-adjusted basis.
The KPI that triggered the change wasn’t CPL in isolation. It was CPL segmented by audience attribute, which revealed that the firm was paying the same price for leads with very different conversion probabilities.
What most KPI guides get wrong about measurement
Most social media KPI guides treat measurement as a reporting problem. Build the right dashboard, track the right numbers, and the insights will follow. That framing misses the harder truth: measurement is a decision-making problem. The dashboard is just the surface.
The real question isn’t “what should we track?” It’s “what decision will this number help us make, and how quickly?” A KPI that takes three weeks to move and requires a full campaign overhaul to act on is less useful than a weekly metric that tells you to swap a headline or change a posting time. Both matter, but they belong in different parts of your measurement system.
What we see consistently at SOL Social Media is that businesses with the most sophisticated dashboards often make the slowest decisions. They’re tracking 40 metrics, generating weekly reports that take hours to read, and spending more time analyzing than acting. The businesses that improve fastest tend to track 5–7 KPIs, review them weekly, and have a clear rule for what each KPI triggers: if CTR drops below X, test a new creative. If engagement rate falls for two consecutive weeks, review the content mix. If CPL rises above Y, pause the campaign and audit the targeting.
That’s not a measurement philosophy. It’s a decision protocol. And it’s the difference between a dashboard that reports activity and one that drives growth. Understanding what social media analytics actually tells you is the prerequisite for building that kind of system.
SOL Social Media turns your KPI data into a growth system
Tracking KPIs is straightforward once the infrastructure is in place. The harder part is building that infrastructure, maintaining it, and knowing which numbers to act on each week. SOL Social Media works with small businesses across retail, healthcare, and professional services to do exactly that: audit existing measurement setups, configure dashboards that surface the right 5–7 KPIs, and run managed social campaigns where every content decision is tied back to a tracked outcome.
The process starts with a KPI audit: reviewing what you’re currently tracking, identifying gaps in UTM coverage and GA4 conversion events, and mapping your existing metrics to actual business objectives. From there, SOL Social Media builds a reporting cadence and dashboard that your team can use weekly without needing a data analyst in the room. For businesses that want full-service management, SOL Social Media’s engagement services cover content creation, community management, and monthly KPI reporting in one package.
If you’re ready to move from tracking activity to measuring outcomes, reach out to SOL Social Media to book a KPI audit and get a clear picture of what your social data is actually telling you.
Sources
FAQ
What are social media KPIs?
Social media KPIs are metrics deliberately chosen because they measure progress toward a specific business objective, with a defined target and timeframe. They differ from raw metrics in that every KPI must connect to a business outcome, such as revenue, leads, or brand growth.
How many social media KPIs should you track?
Track 2–5 KPIs per business objective. More than five per objective creates reporting noise and slows decision-making. Hootsuite recommends mapping 2–3 KPIs per goal and reviewing them quarterly.
What are the 7 C’s of social media?
The “7 C’s of social media” is not a standardized industry framework with a single canonical definition. Different sources use the phrase to describe varying sets of principles, such as content, community, conversation, channel, consistency, credibility, and conversion. The specific list varies by source, so treat any version as a useful mnemonic rather than an established standard.
What is a good engagement rate on social media?
Benchmark ranges vary by platform. Instagram typically runs 1%–5%, TikTok 4%–8%, LinkedIn 0.5%–2%, and Facebook 0.5%–1.5%, based on Brandwatch’s platform benchmark guidance. Your own historical baseline is the most reliable target-setting reference once you have 60–90 days of data.
How do you calculate social media ROI?
Use the formula: (Earnings − Costs) ÷ Costs × 100. Earnings are tracked through GA4 ecommerce or goal value assignment; costs include ad spend, content production, tool subscriptions, and labor. Shopify’s ROI methodology recommends assigning a monetary value to each conversion type before applying the formula.
Recommended
Comments